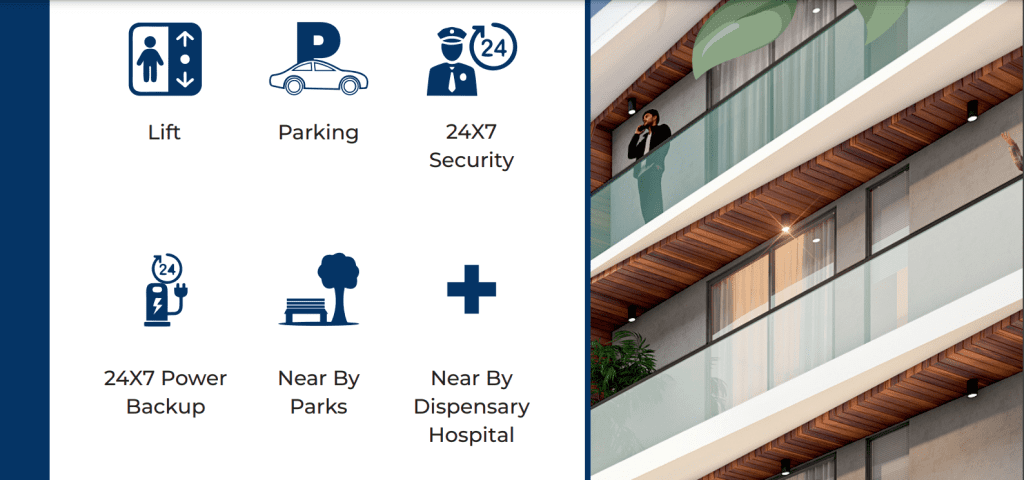
Infographics for Real Estate- Prettify Creative

Graphic-Design
Infographics for Real Estate

Infographics for Real Estate Data: Simplifying Market Trends and Property Information

In the field that is real estate information is the king. Brokers and agents have to deal with an array of data every day, ranging from listing of properties along with market trends, financial statistics, to preferences of clients and demographics. While this data is crucial in making educated choices, it can be confusing for customers who might not be able to comprehend the information. This is the reason why infographics’ power can be a huge help. This blog provides an explanation of the reasons why infographics are essential for simplifying the complex real estate information and the way Prettify Creative can help you with this since Prettify Creative produces the top information graphics that are appropriate for real estate .

Types of Real Estate Infographics

Property Listings: When you sell properties it is helpful to present an infographic that highlights its most important features, local landmarks, and other points of sale. Buyers can quickly grasp the advantages of the property and imagine their future home.
Market Reports: Market information can be overwhelming however infographics help break down this data into charts, graphs as well as visual illustrations. Market patterns, price changes, and inventory data become understood.
Mortgages Finance and Mortgage: Buyers of homes frequently find it difficult to comprehend mortgage rates, down payment and other financial issues. Infographics can guide users through this process and make it easier.
Local Area guides: for prospective buyers unfamiliar with the neighborhood An infographic that highlights the local parks, schools, amenities and transportation options gives an overall view on what living within a neighborhood is like.
Investment Opportunities Real Estate investors profit from infographics that illustrate returns of investment (ROI) as well as rental yields, as well the potential appreciation. This aids them in making data-driven decisions.
Designing Effective Real Estate Infographics:
Making a successful real estate infographic requires a mix of data, design and story telling. Here are some of the most important tips:
1. Be aware of your audience: Adjust your content and layout to the tastes and requirements of your intended group, regardless of whether they are first-time homebuyers, investors or renters.
2. Short and concise messages: Keep the text to an absolute minimum. Utilize bullet points, sentences that are short, and catchy headlines to communicate your message in a short amount of time.
3. High-Quality Visuals: Utilize high-quality images and graphics. Visual impact is a key element of an infographic’s effectiveness.
4. Color Palette: Pick the color scheme that is in line with your brand’s image and the emotion you wish to create. When it comes to real estate properties, warm and welcoming colors are usually preferable.
5. Professional Design Tools: Design software such as Adobe Illustrator and Canva can assist you in creating professionally-designed, polished infographics.
6. Telling stories: Infographics should tell a story. Your audience should be guided from the issue (e.g. or the need for a house) towards an eventual solution (e.g. or your listing of properties).
7. Mobile Optimization: Make sure your infographics work on mobile devices, because a large number of users search homes on tablets and smartphones.
8. Cite sources: If you’re relying on statistics or data, you must give sources to ensure credibility and openness.
Infographics for Real Estate
1. Neighborhood Profiles: Prettify Creative designs the most effective infographics on real estate. These give a comprehensive overview of various communities or neighborhoods. We provide key information such as the average price of homes schools, crimes, and amenities in and around the region. This assists customers in making an informed decision about where they would like to live.
2.Property Listings: Improve the look of property listings by using informational images that show essential information like the size of the home the number of bedrooms, bathrooms, amenities, as well as recent improvements. Add high-quality images to make an appealing and informative presentation for prospective buyers.
3. Market Trends: Monitor and visualize trends in the market in the course of time. The graphs show the variations in median home prices as well as inventory levels and the number of days that properties remain in the market. Customers can make use of these infographics in order to grasp the present state of the market for real estate.
5. Investment Opportunities: For those who are interested in investing in real estate make infographics outlining the potential for investment. Include information on the yield of rental properties, appreciation rates, as well as the financial feasibility of the investment properties.
What Prettify Creative will turn your boring and monotonous data into an informative infographic that is not just able to draw the interest of clients but also help them understand your business.
Data Visualization: We at Prettify Creative will transform complex real estate data into visually engaging infographics. This will make it easier for you to present information about market trends, property listings, and investment opportunities to your clients in a clear and understandable manner.
Professional Design: Our digital marketing experts have the design skills and tools to create visually appealing infographics that will align with your brand. Professional design will not only enhance the infographics’ aesthetic but also reinforce your credibility and trustworthiness.
Time-Efficiency: Creating high-quality infographics is a very time-consuming process, especially for busy real estate brokers like you. Digital marketing professionals and graphic designers at Prettify Creative can efficiently handle the design process, allowing brokers to focus on their core tasks, such as client interactions and property transactions.
Consistency: Our experts will create a consistent streak about your projects which will create a dedicated audience for your product and strengthen your brand’s position and image in the market. This consistency will also make your brand easily recognizable in a competitive market.
Targeted Marketing: Infographics can be strategically shared on various digital platforms to reach a broader audience. Digital marketing experts can optimize the distribution of infographics through social media, email campaigns, and website integration, increasing the broker’s visibility and attracting potential clients.
Real property transactions, be it selling, buying or investing, require numerous data points and data. Infographics are the ideal way to communicate the information in a way that is effective, and because of a number of reasons.
1. Visual Attractiveness: Infographics combine text, images as well as design components to produce attractive content which grabs the attention of viewers. While browsing through the sea of listings for properties as well as market research reports an attractive information graphic stands out and draws viewers to continue exploring.
2. Simplified Information: The world of real property is full of intricate information such as property statistics markets, trends in the market, and financial information. Infographics simplify these complicated data sets into digestible and understandable pieces to help clients make quick and informed decisions.
3. Increased Engagement Engaged Customers: Visual content has been proven to increase interaction on both social networks as well as websites. Through infographics, real estate agents can expand their online presence and keep potential customers interested for longer durations.
4. Brand Differentiation: in a competitive market like property, branding and marketing is vital. Informational and interesting infographics can assist agents and companies in distinguishing their business from others and demonstrate their credibility.

Conclusion:

In today’s highly competitive real estate market and the ability to communicate complex information effectively will distinguish you as a reputable and experienced agent. Infographics provide a potent solution in order to make information simpler, engage customers and improve their knowledge of the latest trends in property and market specifics. When you incorporate infographics into your communication and marketing strategies, you will be able to provide an exceptional customer experience and emerge as an industry leader. Why wait? Get started harnessing potential of information graphics to improve your real estate company today!.

Visit Us at Instagram- Prettify Creative

Have a look at our Graphic Design Portfolio- Portfolio

Our portfolio includes some major names from the Real Estate Industry, Varying from Developers to the Channel Partners. We still cater several of them, which depicts their trust in our service.

At Prettify Creative our designers look at all the aspects of the listed property and create effective infographics for them.

You can call anytime according to your convenience and comfort, or you can visit us between 9:00 AM in the morning up until 9: PM in the evening.

at:  804A, Unitech Arcadia, South City 2, Sector 49, Gurgaon  

Tags :
Graphic-Design
Share This :

Leave a Reply

Your email address will not be published. Required fields are marked *